Rowing a Session
This section explains how you can use and customize the RiM data display during a rowing session.
Swapping Screens
The rowing session display is organized in multiple screens organized in a single horizontal plane. Use a horizontal finger swipe to swap between screens. A scroll bar at the bottom of the screen indicates your position in the horizontal pane that contains all screens.
The different screens allow you to look at different metrics during your exercise and quickly change between them with a simple finger-swipe that’s easy to do even while on the water.
The Toolbar
A short tap with a single finger anywhere on the screen will slide down the toolbar from the top. The toolbar lets your access some quick settings e.g. for Sonification or the screen lock.
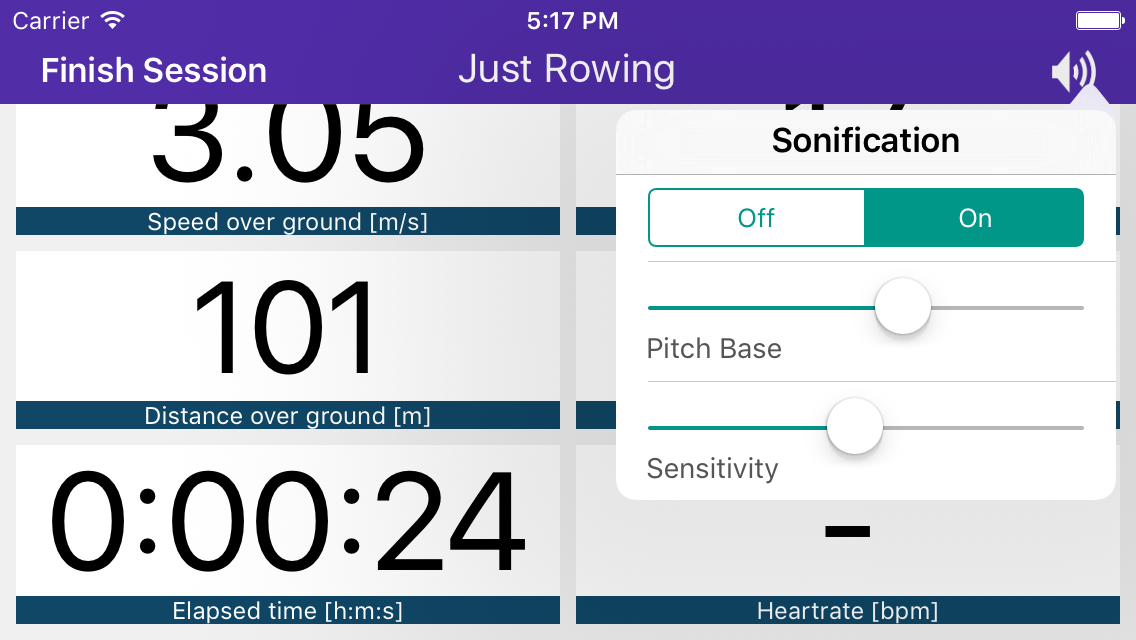
The toolbar will automatically hide after a few seconds.
A tap on “Finish Session” ends the current rowing session. All data measured within your rowing session is automatically captured and saved for later analysis (see Analyzing a Session).
Screen Lock
Another feature accessible from the toolbar is the screen lock. By pressing the lock button, you can lock all interactions with the screen except for a semi-transparent “unlock-slider” at the bottom of the display.
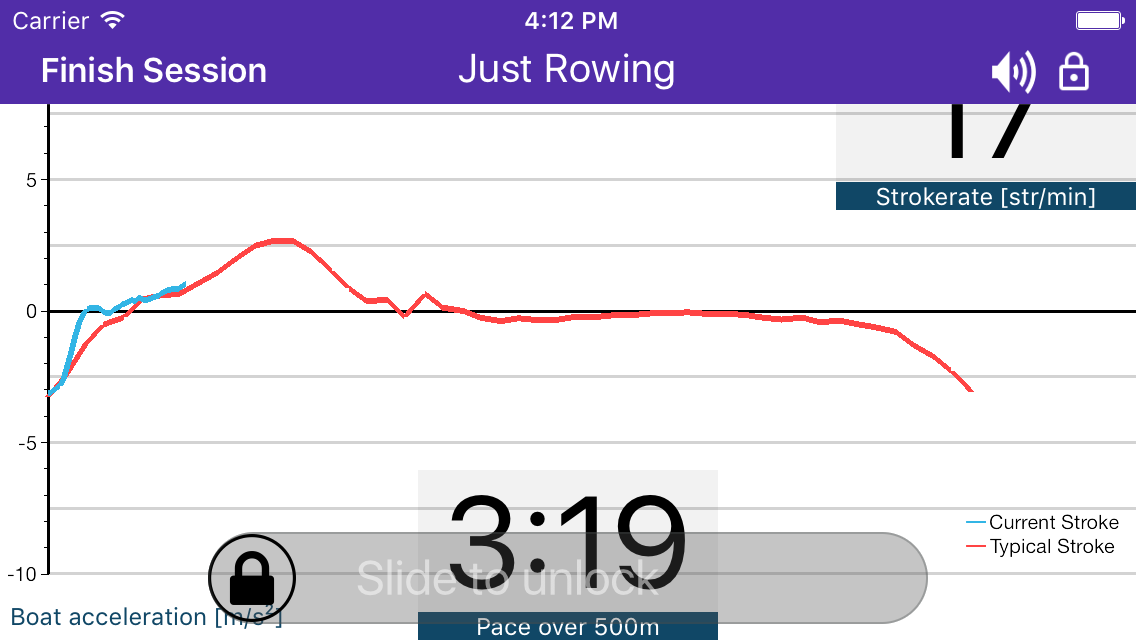
This is useful for avoiding unintended screen interactions e.g. due to water-drops during your exercise. You can unlock the screen by swiping a finger across the slider.
Customizing Data Display
Each of those pages features a fixed layout with customizable “slots” where a performance metric is displayed. You can change the metric to be displayed in any of these slots by tapping on the slot and holding down your finger. While holding down your finger, the slot turns grey.
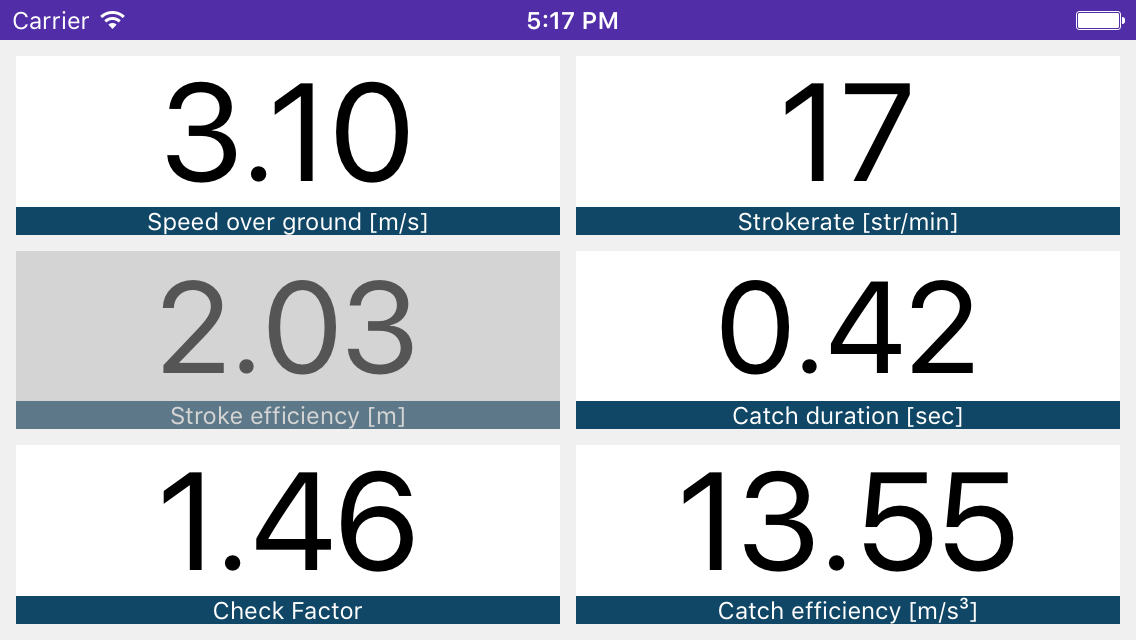
After about one second the selection screen appears, which allows you to change the metric displayed in that slot.
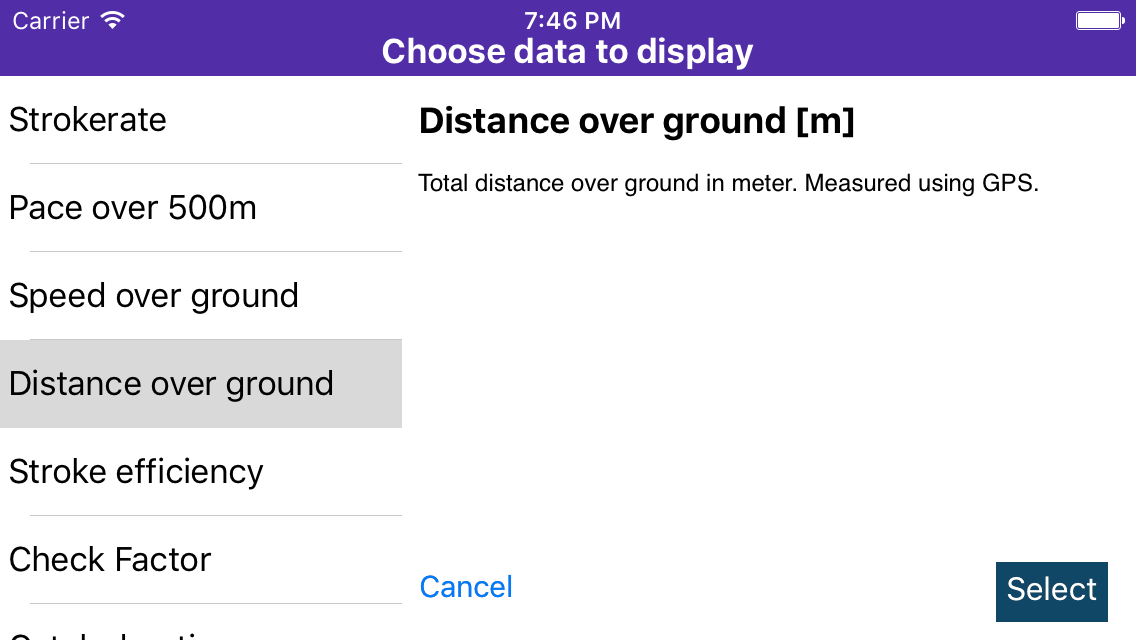
You can then select the new metric that you want to display in the respective slot. You can scroll through the list of available metrics on the left side of the screen and upon selection a description on the right side appears detailing what the metric means. Keep in mind that some metrics like the graphs require a “large” slot and will not be available for selection in small slots.
Any customizations you make to the display settings are preserved between re-starts of the App. If you want to reset the interface to its default configuration, you can do so from the Settings menu.
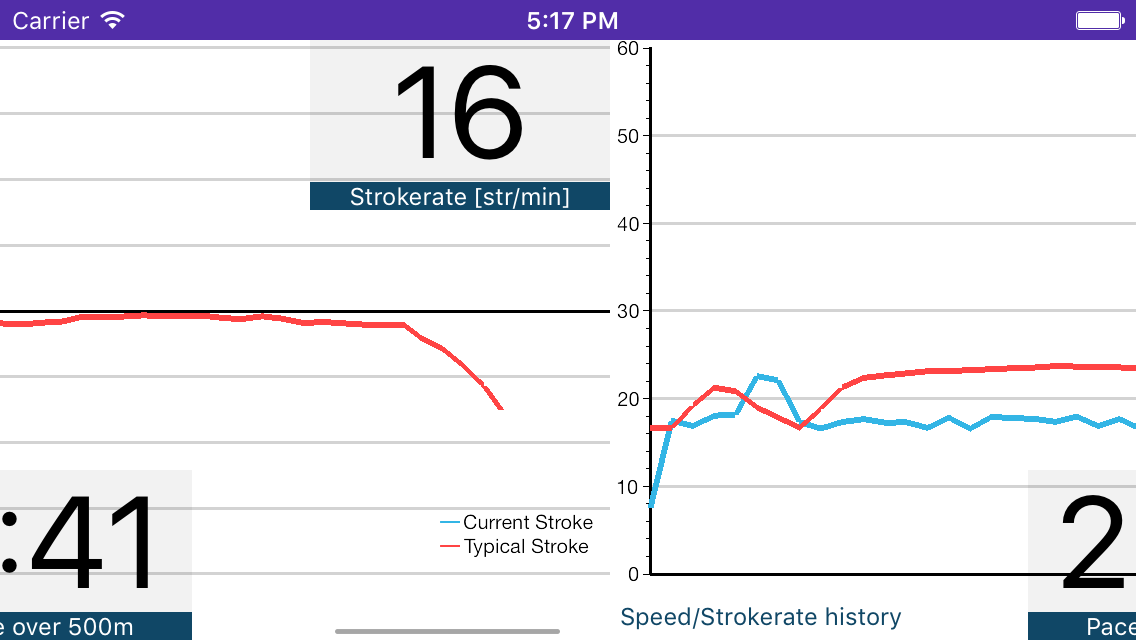
Acceleration Graphs
The acceleration graph is at the core of analyzing and improving your rowing stroke. Boat acceleration is the result of the force applied to the boat and its structure can tell you a lot about how you move the boat through the water.
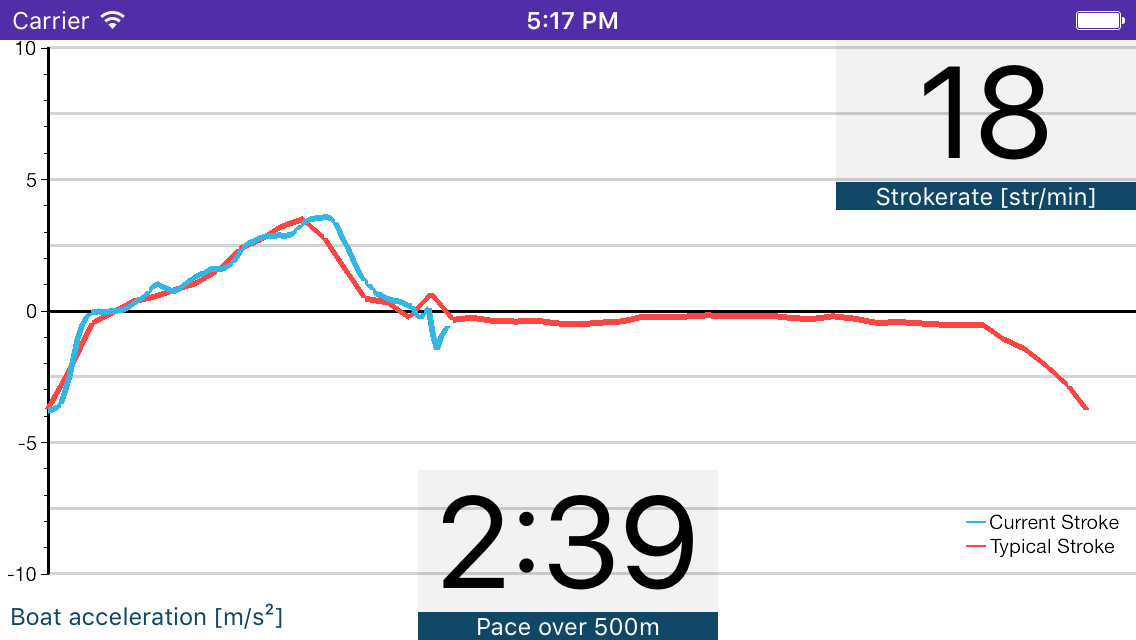
The blue line is the acceleration of your current stroke. The red line is an average calculated from your last 5 strokes and updated every 5 strokes so you can always compare your efforts.