Race Analysis
Race Analysis allows you to set a race’s starting point and have analytics automatically calculate splits, times, average speeds and typical stroke profiles for you.
You can access Race Analysis from a logfile’s detail view by clicking on the “Race Analysis” button in the “Analysis” box.
Options
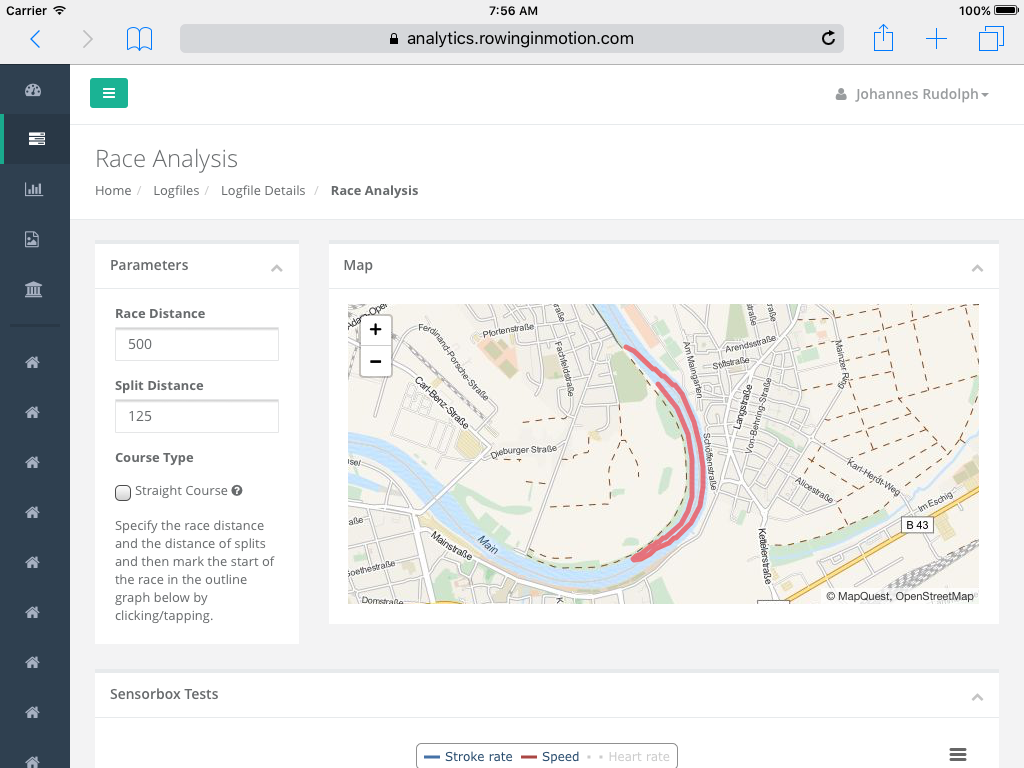
Specify the total race distance as well as the desired split distance. Total Race Distance must be a multiple of the split distance.
When you select the “Straight Course” option, Analytics will assume that the race is held on a straight regatta course and calculate boat displacement (distance relative to the start) and boat velocity (displacement/time).
If the straight course option is not selected, Analytics will calculate the actually travelled distance (including all steering) and boat speed based on that.
Setting a Start Point
After specifying the necessary parameters as explained above, you need to set a start marker. Place the cursor/fingertip right before the first stroke of your race and click/tap down. This will set the start marker to the specified point.
Tip
Use the zoom controls on the chart to make a more exact selection.
With the start marker set, click the “Calculate from Marker” button to have Analytics calculate the race analysis for you. The speed and stroke-rate outline graph will highlight start and finish of the race, which you can use to see the strokerate and speed over time. Details for the individual splits and typical stroke profiles are listed in a table below the outline graph.
Note
Saving Race Analysis is currently not supported. Until we add a feature to compare races to analytics, you can print/screenshot them for your own record-keeping.