Typical Stroke Analysis
Analytics allows you to create analyses on your logfiles. Contrary to other measurement systems, we felt it would be the easiest for Athletes and Coaches to just record complete rowing session and then pick the parts to analyze later. This avoids the dreaded “forgot to record” problem, which is really painful when you can’t repeat the measurement (e.g. when you want to record a 2000m race).
An analyses on a logfile is always stored together with the logfile, so when you delete a logfile all analyses based on it will be naturally gone as well.
Understanding Typical Stroke
Humans are no robots, and that means athletes have a hard time repeating a given motion sequence (the rowing stroke) exactly the same way every time. To make a point, let’s make this simpler and try rowing at a constant stroke-rate with the same power (in Watts) on a standard C2 ergometer. It’s a fun game, but you will immediately realise how hard it is. Because there’s a huge amount of natural “fluctuation” or noise between every stroke (and not considering environmental factors like waves, balancing the boat etc.) it’s hard to discern significant changes from noise in measurement data when you look at it on a stroke-by-stroke basis.
Sampling Typical Strokes
That is why analytics allows you to perform a “typical stroke analysis”. What this does is looking at a range of strokes and then statistically determine an “average” stroke based on that data. The advantage of this approach is that it leats you easily compare different analysis and find significant changes, rather than fiddling through the “noise” of stroke-by-stroke analysis. When we say “average” that is not exactly true, as it uses a statistical sampling method on normalized stroke data.
In general, the more strokes you sample the better the result. You should also try to avoid sections with huge fluctuations in stroke-rate. Analytics will reject outlier-strokes based on statistical tests but as you probably know even the smartest tests can’t defeat the garbage-in-garbage-out principle.
Normalizing Typical Strokes
As we’ve seen above, analyzing data on a stroke-by-stroke basis is not practical because it would be difficult to reason whether a determined change results from natural fluctuations or a significant change in the athletes “true” stroke. In this section, we are going to explain how
One problem when comparing two rowing strokes is that stroke-rate is never really constant. Even if a crew rows at an apparently constant stroke-rate there are many subtle stroke-to-stroke timing differences when you look at an exact stroke-rate counter that shows you what’s behind the decimal point. However, even small differences in stroke length matter when we want to compare the acceleration profiles of two strokes.
So In order to allow coaches and athletes to make better judgements about the changes in typical stroke acceleration profiles, we need to be able to ensure analysis can be created at perfectly matching stroke-rate.
This is where normalization of typical stroke profiles comes in. Calculation of typical stroke profiles basically works like this:
- Split the recorded acceleration values into individual strokes
- Determine the average stroke-rate and re-sample all strokes to that length (normalization)
- Determine the average acceleration at each sample point to build the typical stroke profile
Of course we have to consider that typical acceleration patterns change with stroke-rate. For example, it is common to see positive acceleration in the recovery as the crew needs to move faster on the slides to achieve a higher stroke-rate. To ensure profiles are calculated for well-defined stroke-rates, typical stroke profiles are calculated for whole stroke-rates only (eg. 17.0, 18.0 etc.). Additionally, the algorithm discards strokes from the calculation that are outside of the +/- 1 range around the target stroke-rate. Within this window, normalization is a valid approximation.
You can review the number of strokes that were sampled to calculate a typical stroke profile in the table with the metrics. Generally speaking, the more strokes sampled the more representative this typical stroke profile is.
Creating a Typical Stroke Analysis
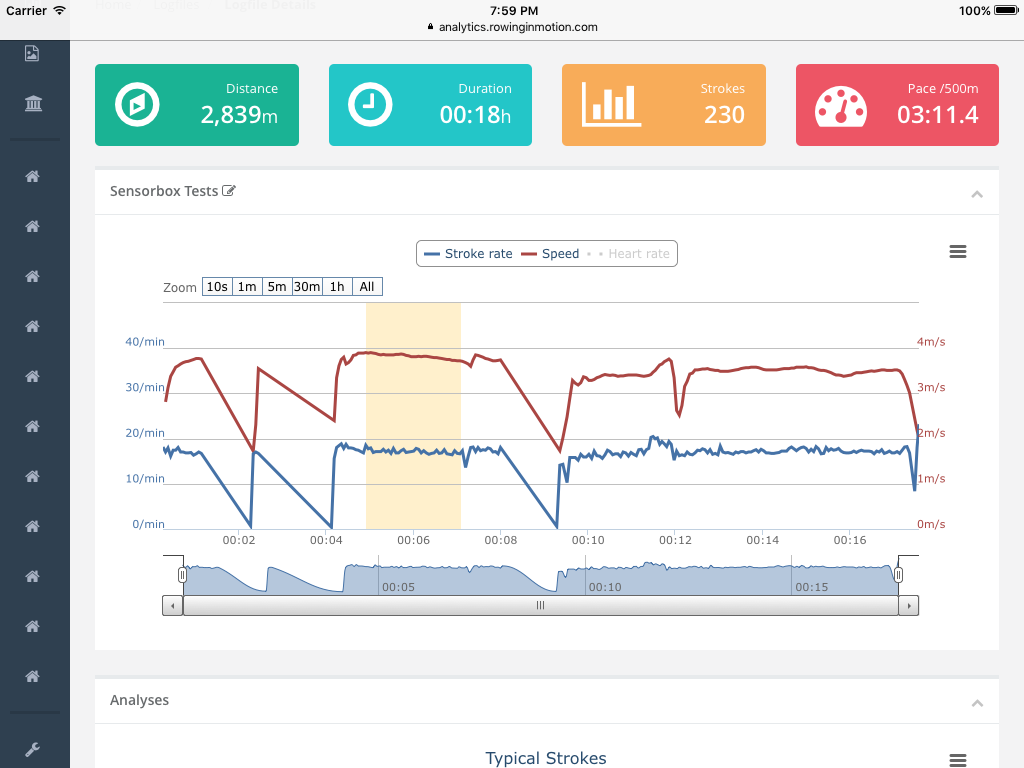
To create a typical stroke analysis, open the details of a recorded rowing session and selection the section you want to analyze by dragging over the outline chart.
Tip
Use the zoom controls on the chart to make more precise selections.

After releasing your mouse click (or finger) from the chart, Analytics will calculate a typical stroke analysis for you and add it to the Analysis box. Each typical stroke selection gets its own highlight color so you can easily discern them. This highlight color matches with the color used in the typical stroke chart.
Below the chart you wil find a table with the stroke metrics for each analyzed typical stroke. You can also add custom notes to each typical stroke in this table. These notes will be very helpful when you later try to compare your analyses.
Click “Save Changes” to store the created analyses. When you open this rowing session later, Analytics will automatically display your saved analyses stored for this session.
Comparing Typical Stroke Analysis
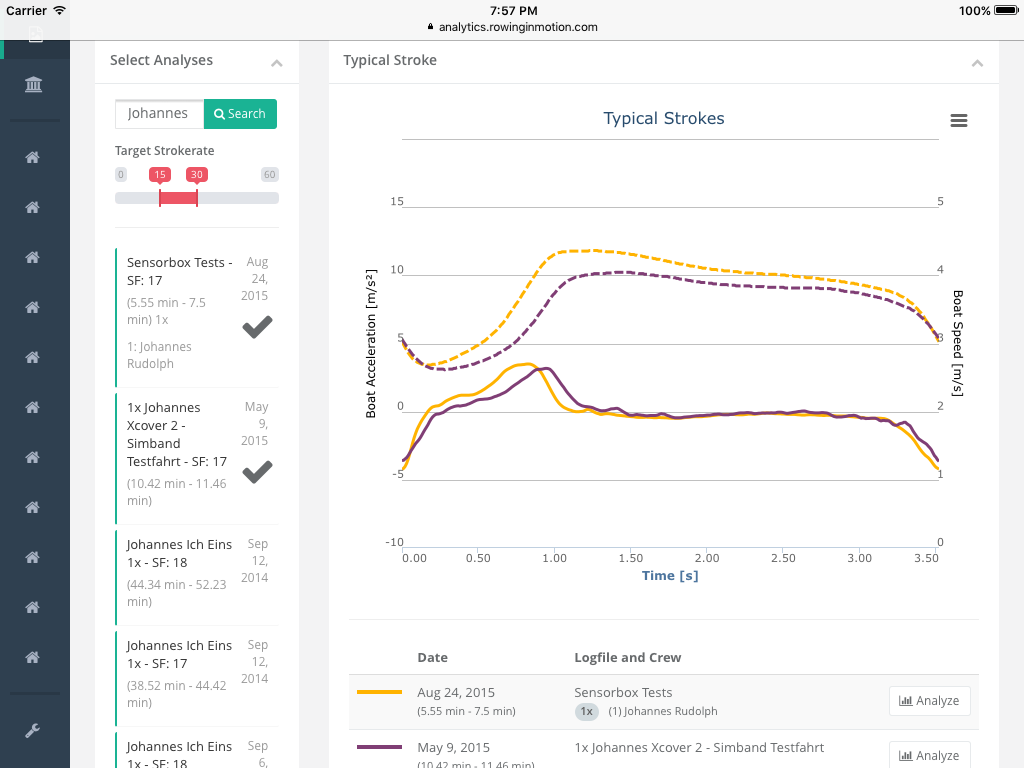
Analytics allows you to compare typical stroke-analysis created from different rowing sessions. You can open the comparison tool by opening the “Analyses” section from the navigation menu.
Comparing typical stroke analyses from different sessions is very useful to track athlete or crew performance development over time (longitudinal) or to create cross-comparisons. You will for sure gain some exceptional insights into good rowing technique by comparing crews of similar physical ability that achieve very different boat-speeds on the water.

Use the searchbox and filters to find anlayses. Clicking on a search result adds the corresponding typical stroke analysis to the comparison chart.