Rowing Stroke Metrics
We have carefully evaluated a range of different metrics and have selected the ones we found the most useful and expressive in daily training. All metrics share the common goal of capturing a property of the acceleration graph in a simple to interpret number. We hope this helps coaches compare different stroke characteristics on a more objective basis.
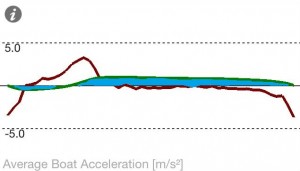
All metrics are calculated based on average strokes. For all graphs displayed in the following, the red line you see is the averaged acceleration graph, whereas the green line is the relative speed over time.
Note
The reference point for relative speed is the catch at the very left of the stroke graph. The relative change in speed is highly imporant in rowing. The result of applying acceleration to our boat is a change in speed.
Effective rowing technique aims to achieve a high average speed over the course of a stroke with minimal variation. That’s why the structure of the speed curve is highly important.
Drag Efficiency
The most efficient way to move a boat through the water is at a constant speed. When the velocity of the boat varies throughout the stroke, energy is wasted overcoming the disproportionally higher drag encountered in those parts of the stroke when the boat moves faster than the average speed.
Drag efficiency captures this accurately by calculating the power required to move the shell at a constant speed of 5m/s (which is equiavlent to a 6:40min on a 2000m race) and the power required to move the shell at an average speed of 5m/s with the velocity variations of your current typical stroke.
A drag efficiency of 90% would thous imply that 90% of your power is used to overcome the inevitable drag whereas the remaining 10% of power applied are wasted on additional drag resulting from velocity variations. If you were able to improve drag efficiency by 1%, you can save roughly 1.4s on a 2000m race while maintaining the same rowing power.
How can we calculate this number without knowing the actual power in terms of watts that the crew puts into the system or knowing the specific drag factor of the boat being used? Put simply, the mathematic model behind this metric is formed in such a way that all these factors cancel out. By projecting velocity variations to the same average speed of 5.0m/s this metric is comparable between crews and differing environment conditions while at the same time allowing an intuitive interpretation (seconds saved over 2000m race).
Stroke Characteristic
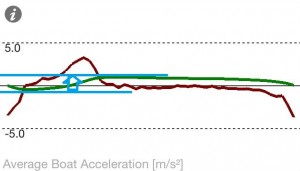
Stroke characteristic tries to estimate how a crews distribution of power is over the stroke. The basic idea is that the boat has a higher average speed if the crew maintains a high boat speed for a longer part of the stroke. Stroke characteristic is calculated as the area under the speed graph, marked in blue below.
We need to be careful interpreting that number as a distance however, since we’re not measuring absolute speed but relative speed. So this is the distance covered each stroke due to the deviation of boat speed from the speed at the catch.
What affects stroke characteristic? The two most important factors are the catch and recovery phase. Remember that the boat is slowest while catching, so it’s important to bring the boat back up to speed as fast as possible. After the drive phase, we enter the recovery phase with maximum velocity. Because the recovery phase is quite long, it’s important to maintain this velocity for as long as possible. In the above example, we see deceleration (red) very early in the recovery phase, corresponding with a decline in boat velocity (green).
Very good rowers achieve a stroke characteristic between 2.5 and 3.5 in the single sculls at 20spm.
Catch Duration
Catch duration measures the time your boat is decelerating at the catch.
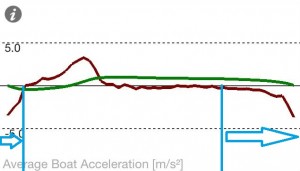
Catch duration is measured in seconds and lower numbers are usually better. Crews with a good recovery phase achieve catch durations below 0.35s. This metric is not very dependent on stroke-rate and the length of the deceleration phase is typically constant in a wide range of stroke-rates from steady-state to race rates.
Remember though, that the catch is not only about how long you deccelerated your boat, but also about the intensity. How well a crew manages this trade-off can be seen in stroke efficiency.
Catch Slope
After the blades hit the water, it’s important how fast you can start accelerating your boat again. Catch slope is the slope between the point of maximum negative acceleration and the point where zero acceleration was first hit. This is illustrated in the figure below. Catch slope is the slope of the blue line.
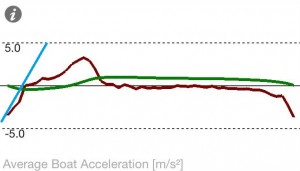
A higher catch slope is advantageous because it indicates at a quick increase of boat speed at the catch.
Very good rowers achieve values exceeding 70m/s³ at steady state-rates (20spm). You should see a fair increase as the rate goes up.
Check Delta
The check delta is simply the difference between maximum and minimum boat velocity. It gives you the delta of boat velocity variation.
A lower check delta indicates a smoother movement of the boat, which is advantageous because it minimizes the loss of energy of the rower-boat system due to friction. The problem with friction or more precisely drag is that it increases non-linear with boat speed (in fact, the power to required to overcome drag is proportional to the cube-root of velocity!). This means that at the same average boat speed over the stroke, differently shaped speed graphs can result in a very different total energy expenditure.
We suggest you use this number as a relative indicator (i.e. to judge the development of a sepcific crew) but not to compare the performance of different crews as we found it has limited usefulness for this purpose. Unlike the other metrics, we found no clear corellation between very good and “not-so-good” crews on this metric. It is useful as an indicator of what’s changing within a specific crew though.